AUTOSPEX®
World’s Leading Infrastructure Condition Assessment Platform
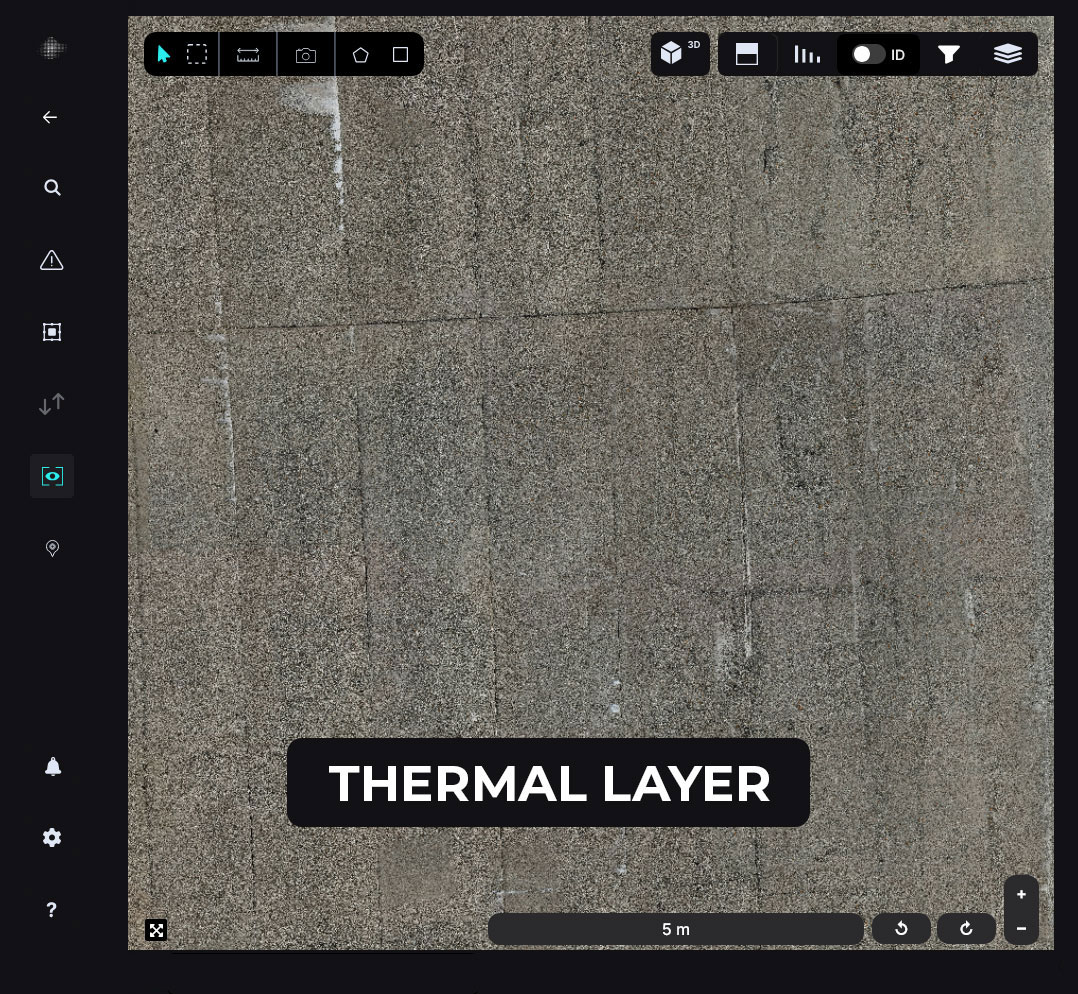
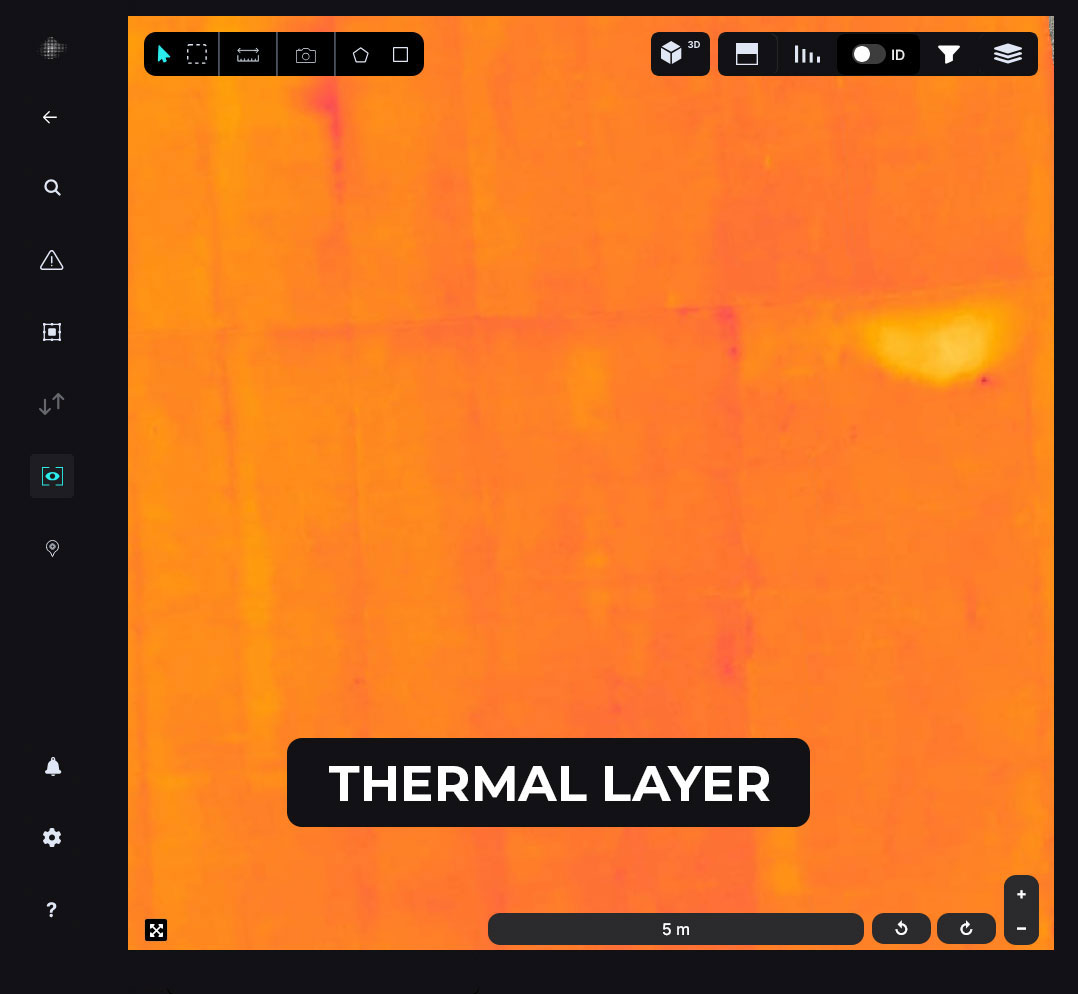
AUTOSPEX uses optical imagery to identify surficial defects on concrete surfaces. We also use commercial-off-the-shelf thermal cameras to identify and map voids and delamination up to 50mm into the concrete. Our proprietary acoustic sensor can detect and create a geo-referenced map of delamination.
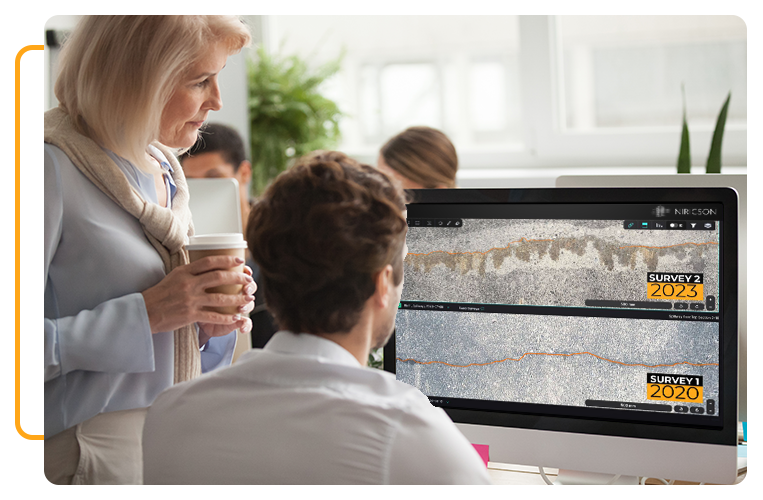
Comparison Mode
Enables side-by-side visualization of two surveys with synced navigation to detect changes, compare defect states, and assess structural evolution over time.
Track deterioration and evaluate repairs
In large-scale infrastructure, subtle deterioration can lead to major failures. AUTOSPEX makes it easy to monitor those changes over time.
With Change Grid and Comparison Mode, engineers can compare two surveys side-by-side and identify increases, reductions, or newly formed defects. Whether it’s a spillway slab or a bridge pier, you’ll know exactly what changed and where.
🔧 What you can do:
- Compare two inspections using a split-screen viewer
- Sync, swap, or unlink views for detailed visual analysis
- Highlight change intensity by defect type and location
- Filter and flag areas of concern for follow-up or rehab
✅ Why it matters:
- Establish a reliable digital baseline of asset health
- Quantify deterioration over time
- Evaluate repair effectiveness and contractor work
- Detect material performance issues early
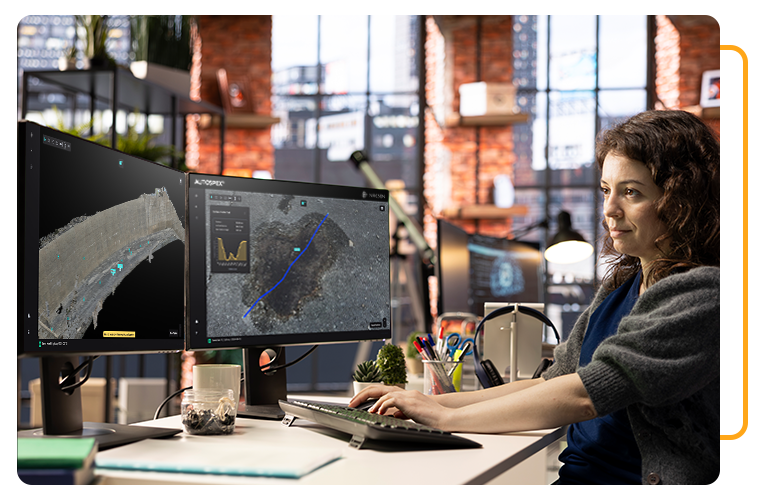
Inspect in 3D. Elevate your inspection accuracy
Not all defects are obvious in 2D. With AUTOSPEX’s 3D Viewer and Surface Profile Tool, engineers can explore structural surfaces in three dimensions and capture highly precise measurement data.
🔧 What you can do:
- Navigate and inspect high-resolution 3D models
- Measure surface elevations, profile dips, and spall depth
- Switch between base models and measurement layers
- Visualize elevation loss near past repair zones
✅ Why it matters:
- Quantify deterioration with precision
- Support repair planning and prioritization
- Verify contractor work with detailed visual context
- Analyze structural change beyond what’s visible
Surface Profile Tool
Allows users to analyze vertical or horizontal surface profiles in 3D models, enabling precise measurement of crack depth, elevation changes, and surface irregularities.
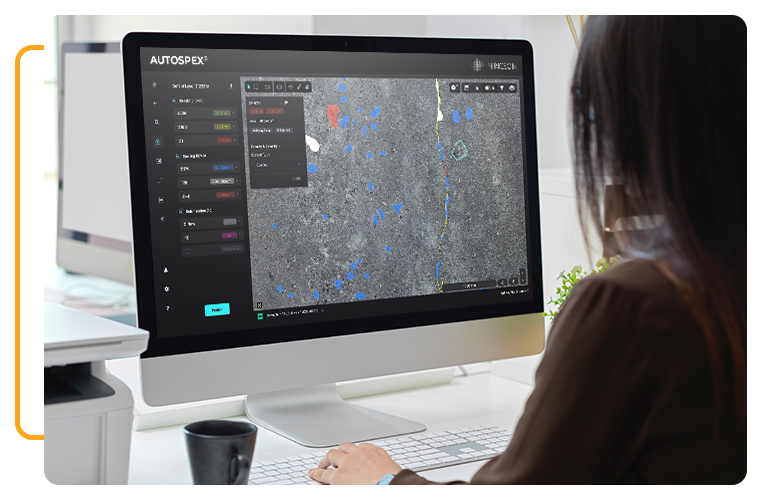
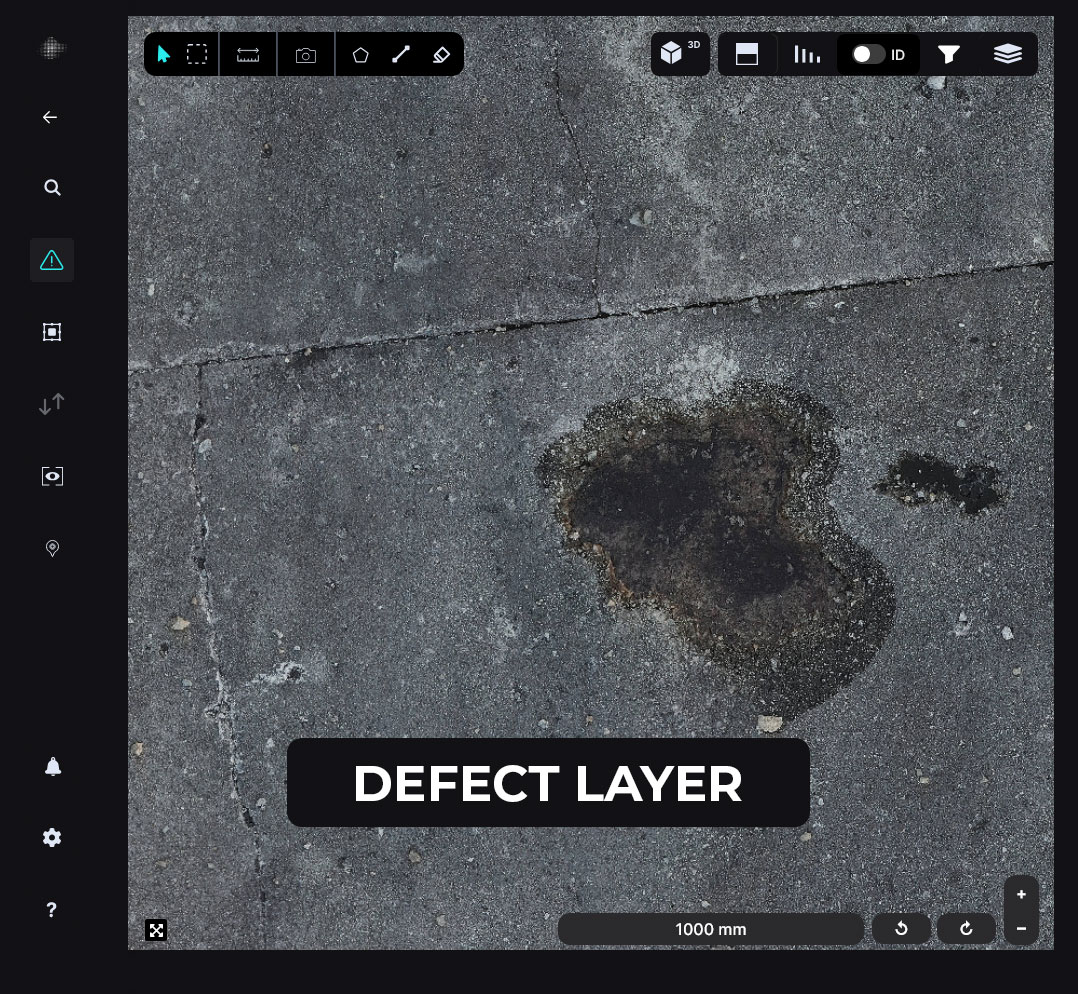
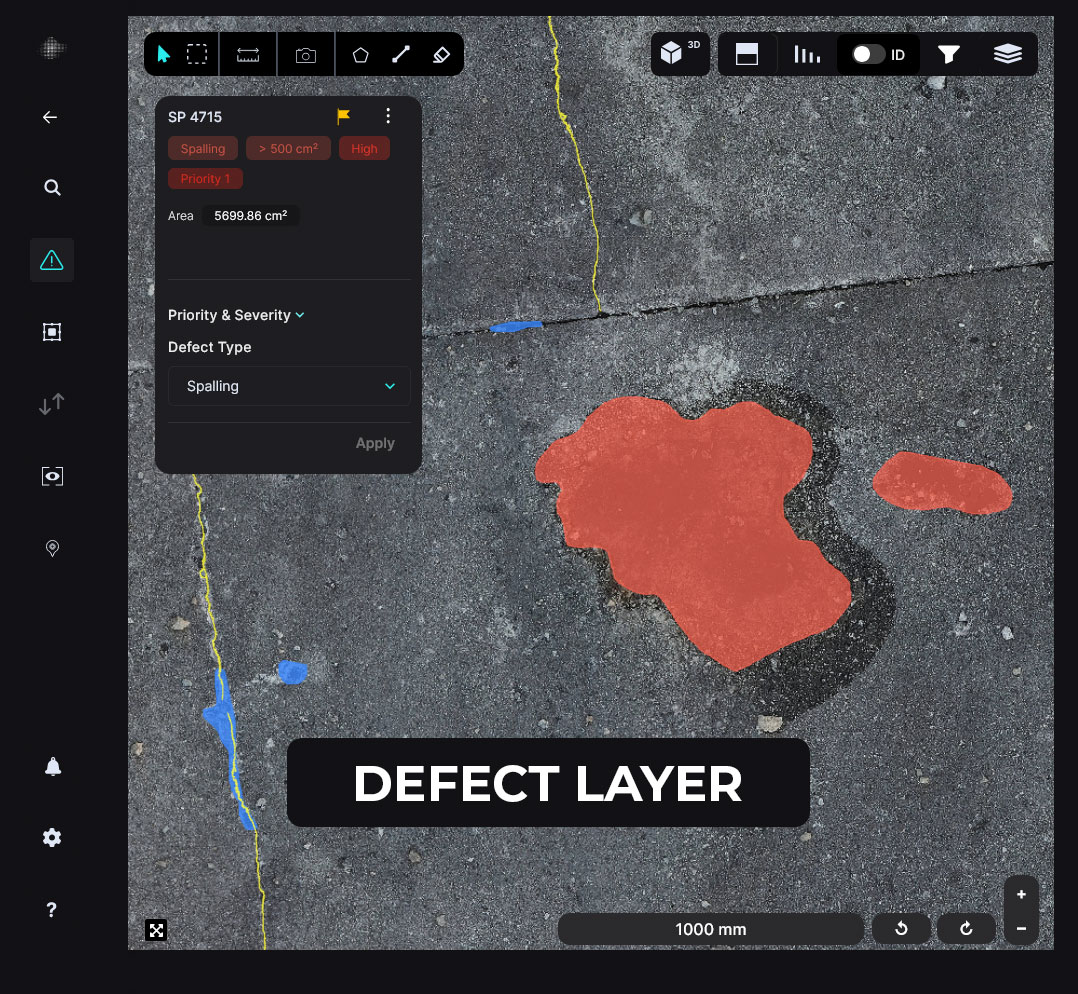
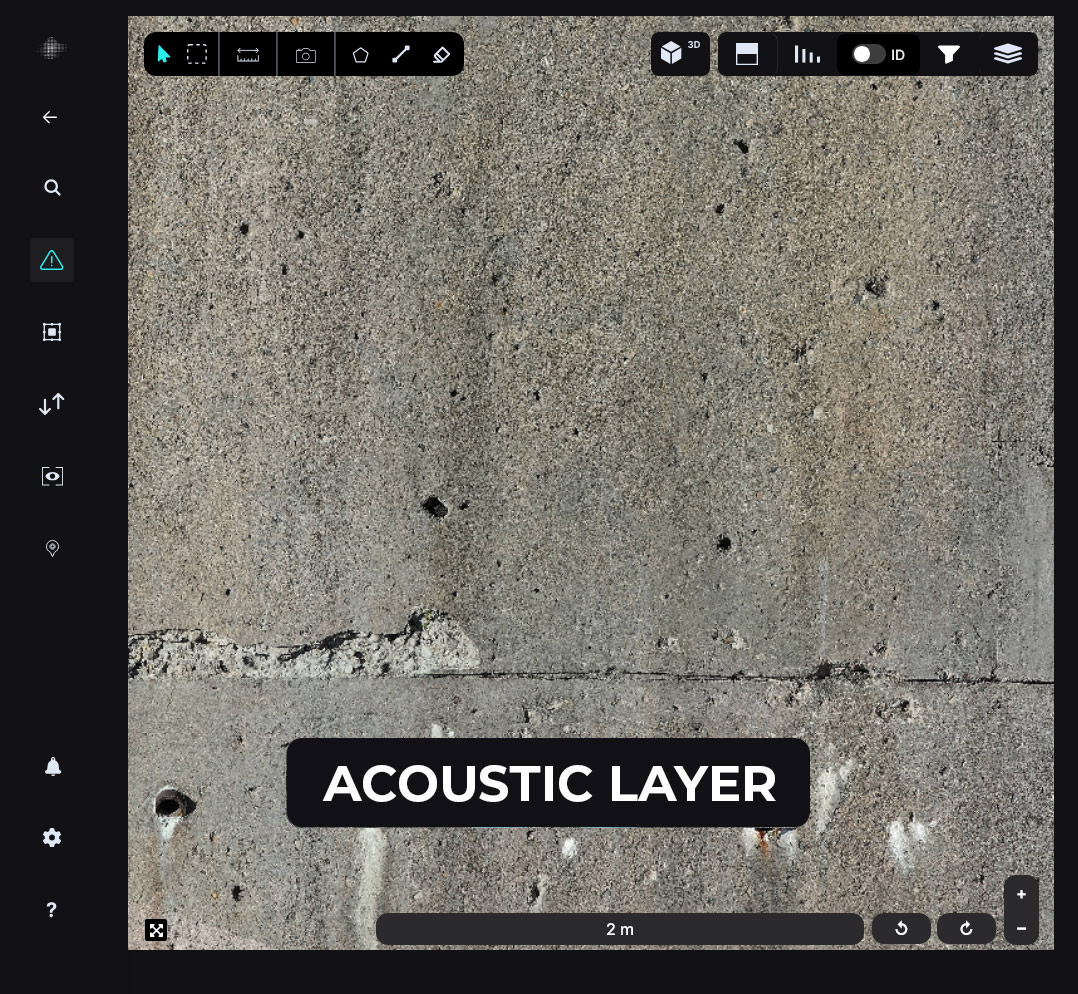
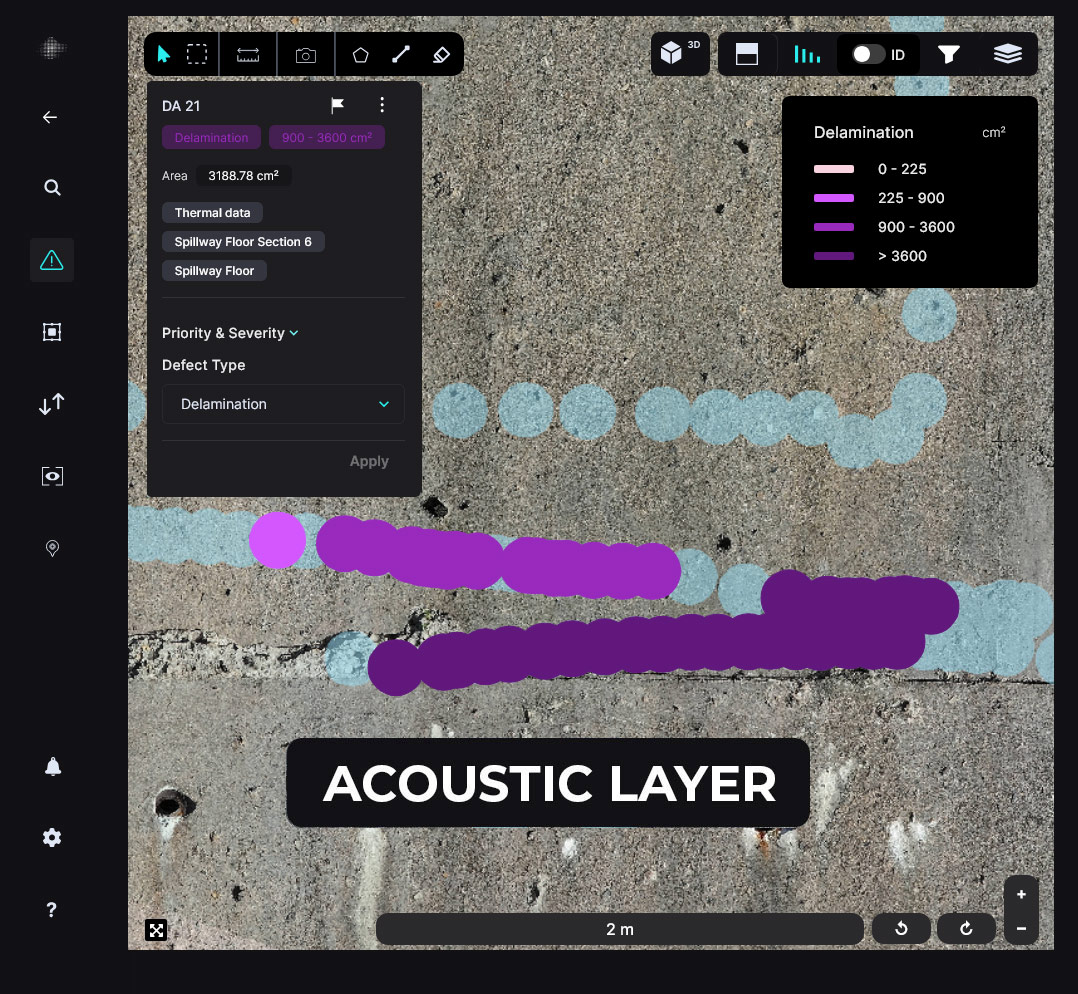
Defect Map and Quantification
Displays automatically detected defects—such as cracks, spalls, delamination, and thermal anomalies, on high-resolution maps, with quantified metrics including length, width, area, and severity for each defect.
Visualize and Quantify defects with clarity
AUTOSPEX automatically maps both surface and subsurface defects using AI-powered analysis. Engineers can view high-resolution defect maps, toggle between multiple layers, and filter by defect type, severity, and dimensions.
🔧 What you can do:
- View all AI-detected cracks, spalls, and delamination
- Filter defects by size, area, or location
- Toggle defect layers and density grids on/off
- Click on any defect to access its full quantification data
✅ Why it matters:
- Get full structural visibility in one platform
- Identify hotspots by type and severity
- Flag and prioritize repairs
- Save time with data-driven filtering and search
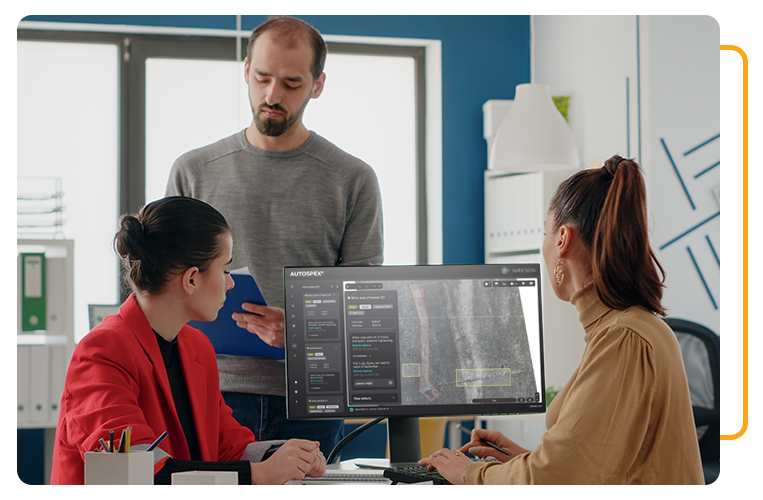
Collaborate around what matters
Infrastructure teams often need to zero in on high-risk sections, quickly and collaboratively. With Focus Areas in AUTOSPEX, you can define a zone, label its condition, assign priority, and propose actions, all within a shareable, color-coded layer.
🔧 What you can do:
- Draw rectangles or polygons to define critical areas
- Assign condition, priority, and recommended action
- Share links with your team for seamless handoff
- View, edit, archive, or report on each area
✅ Why it matters:
- Enable real-time collaboration
- Organize inspections around what’s urgent
- Streamline reporting with ready-made Focus Area summaries
- Reduce communication gaps across teams and departments
Focus Area
Enables users to define and label critical zones on the map, assign condition and priority levels, and collaborate on recommended actions for targeted inspection, analysis, and maintenance planning.
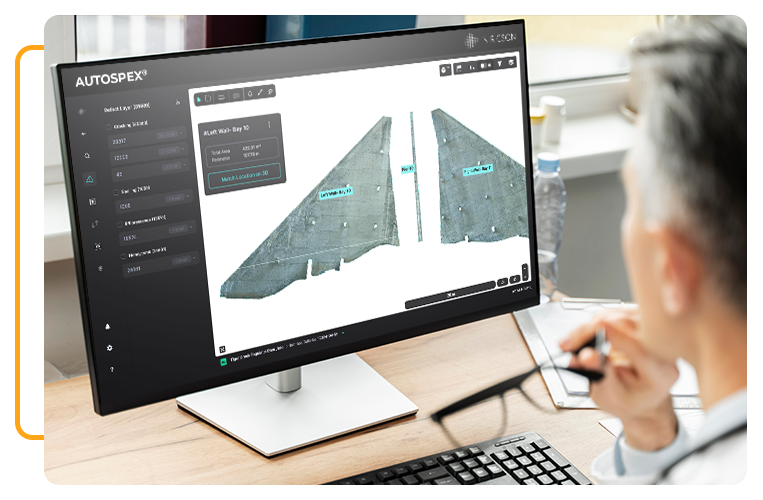
Location Feature
Allows users to define structural zones within the asset, automatically tag defects by location, and link 2D map areas with corresponding sections in the 3D model for organized inspection and reporting.
Bring order to complex assets
Large structures like dams, spillways, or tunnels often contain dozens of inspection zones. AUTOSPEX lets you define, tag, and manage those zones using the Location Tool.
🔧 What you can do:
- Define structural zones
- Auto-tag defects based on location boundaries
- Match locations between 2D and 3D
- Export defect data by location
✅ Why it matters:
- Navigate assets more efficiently
- Localize issues and inspections
- Track deterioration zone by zone
- Make reporting easier and more structured
Turn inspection data into decisions
AUTOSPEX transforms survey data into clear, structured PDF and CSV reports—perfect for internal review, contractor coordination, or compliance documentation. Choose from full survey summaries, Focus Area breakdowns, or flagged defect lists.
🔧 What you can do:
- Generate Survey Reports with 2D maps, grids, and defect data
- Export Single or Bulk Focus Area Reports
- Include defect photos, locations, and measurements
- Download flagged issues for targeted repair planning
✅ Why it matters:
- Make data shareable and actionable
- Communicate clearly with contractors
- Keep records for compliance or future inspections
- Reduce time spent building manual reports

Survey Report
Generates downloadable reports in PDF and CSV formats, including 2D asset layouts, defect density grids, location-based summaries, and detailed defect data for documentation, analysis, and team collaboration.
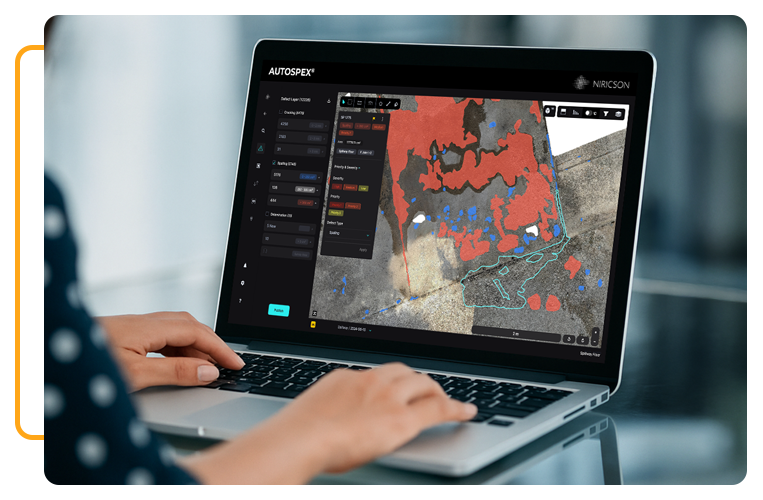
Defect Severity
Enables users to assign severity levels and maintenance priorities to individual or grouped defects, supporting condition-based maintenance planning and risk-based decision-making.
Know what’s critical, and what can wait
Not every defect is urgent, but some demand immediate attention. AUTOSPEX lets you assign Severity (High, Medium, Low) and Maintenance Priority (1–2–3) to every mapped defect, helping teams triage with confidence.
🔧 What you can do:
- Set and update severity levels per defect
- Assign priorities for rehab or follow-up
- Combine with Focus Areas and Reports
- Export defect lists with severity metadata
✅ Why it matters:
- Triage high-risk zones quickly
- Prioritize maintenance by impact
- Plan inspections more effectively
- Align engineers and contractors on urgency
Take your data from map to design
AUTOSPEX lets engineers export quantified defect data directly into CAD or design software. Download by location, defect type, or filtered area to bring real-world insights into AutoCAD, GIS tools, or asset planning platforms.
🔧 What you can do:
- Download full or filtered CSV datasets
- Include severity, defect type, dimensions, and X-Y location
- Import into AutoCAD or other design workflows
- Access in both metric and imperial units
✅ Why it matters:
- Save time on data re-entry
- Align inspection insights with design overlays
- Use inspection data to inform design and rehab
- Create a seamless workflow from inspection to execution

How is AI used in civil infrastructure inspections?
AI is used to automatically detect, classify, and quantify defects like cracking, spalling, and delamination in structures such as bridges, dams, and airfields. By analyzing image data, AI can reduce subjectivity, speed up inspections, and improve accuracy in condition assessments. Niricson’s AUTOSPEX platform leverages advanced AI to map and quantify defects automatically, supporting more efficient and objective infrastructure inspections.
Can AUTOSPEX distinguish between surface-level and subsurface defects in dams?
What are the benefits of using machine learning for asset condition monitoring?
Machine learning models can identify patterns in defect progression, predict deterioration trends, and support data-driven maintenance planning. Over time, these systems help optimize inspection frequency, reduce risk, and lower lifecycle costs. AUTOSPEX uses AI-powered data fusion to provide predictive insights, helping infrastructure owners plan smarter and extend asset life.
How does AUTOSPEX help monitor long-term deterioration in dam structures?
AUTOSPEX uses Change Detection and Comparison Mode to track deterioration across multiple surveys. Engineers can detect growth in cracking, spalling, or delamination over time, helping prioritize repairs and build a long-term asset health baseline.
Can AI replace traditional infrastructure inspection methods?
AI doesn’t replace human inspectors, it enhances their capabilities. Automated tools handle large-scale data processing and surface-level defect mapping, while engineers focus on analysis, decision-making, and rehabilitation strategies. With AUTOSPEX, inspectors gain AI-assisted tools for mapping, measurement, and reporting, improving efficiency while keeping engineers in control.
How can AUTOSPEX support dam safety reporting and regulatory compliance?
AUTOSPEX generates detailed, shareable reports including severity ratings, priority levels, location tags, and photos. These can be used for internal reviews, regulatory documentation, or contractor scoping.
How can digital twins improve maintenance planning?
Digital twins consolidate data from multiple inspections and sensors into a centralized, visual platform. This makes it easier to detect trends, localize issues, simulate failure scenarios, and schedule proactive maintenance. Niricson helps asset owners build digital condition records by linking inspection data, 3D models, and change detection into a unified view through AUTOSPEX.
How can AUTOSPEX be used to evaluate contractor repairs on bridges?
By comparing surveys taken before and after repair work, engineers can assess if defects were properly addressed. The platform highlights material degradation, spalling near patch zones, and surface inconsistencies.
What is automated defect mapping in civil engineering?
Automated defect mapping uses computer vision and AI to identify defects such as cracks, spalls, and delamination on structural surfaces. It removes the need for manual markup and provides consistent, scalable condition data across assets. AUTOSPEX automatically maps and quantifies defects from photogrammetry or drone-based scans, removing subjectivity and streamlining inspections.
Can AUTOSPEX handle multiple bridge spans and sections in one inspection?
Absolutely. Using the Location Tool, engineers can break down bridges into structural components (e.g., piers, deck bays, expansion joints), making it easier to analyze and report by zone.
How do digital inspection platforms reduce asset risk?
Digital inspection tools offer real-time data, repeatable measurements, and visual documentation that supports better decision-making. They help teams catch early-stage deterioration and avoid costly emergency repairs. Niricson’s AUTOSPEX platform enables earlier detection and better prioritization by combining AI, defect quantification, and severity assessment.
How does AUTOSPEX support airfield pavement inspections without disrupting operations?
With tools like photogrammetry and ROVER, inspections can be performed during off-peak hours—even at night. Data is captured quickly and analyzed offline, minimizing runway downtime.
What is a digital twin in infrastructure asset management?
A digital twin is a virtual representation of a physical asset, such as a bridge or dam, that includes geometry, condition data, and performance history. It’s used to visualize, monitor, and simulate how the asset behaves over time. AUTOSPEX supports digital twin workflows by providing high-resolution 3D models and defect data tied to real-world coordinates and conditions.
What kind of data does AUTOSPEX provide for airfield asset management?
AUTOSPEX delivers PCI-relevant defect quantification, including spall size, crack depth, and density mapping. All defects are tagged to precise locations, making it easy to plan maintenance by zone.
Why are 3D models important for inspecting civil infrastructure?
3D models offer engineers a detailed spatial view of complex structures. They enable more accurate measurements, help identify surface irregularities, and allow inspection teams to assess deterioration without needing full physical access. AUTOSPEX includes a 3D Viewer and Surface Profile Tool, allowing users to explore and measure infrastructure in millimeters directly within the platform.
What’s the difference between manual and automated condition assessments?
Manual inspections rely on visual observation and subjective judgment, while automated condition assessments use imagery, sensors, and AI to capture consistent, measurable data. Automation increases coverage, accuracy, and repeatability, especially on large or hard-to-access structures. With AUTOSPEX, inspection teams can scale assessments across assets, gain standardized defect data, and produce actionable insights faster than manual methods.
